|
... II. The Framework ...
values

 paradoxes
|
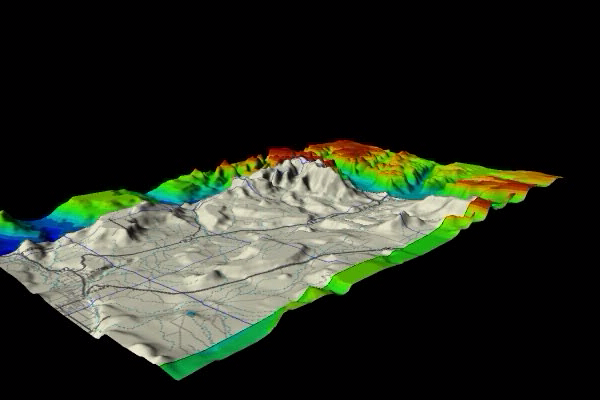
Figure 29. Hurricane to Zion National Park in Southern Utah.
Another point is that large data sets create new kinds of maps. For instance, other than
showing their location, 3-D seismic surveys can not be summarized as a single map. It takes many, many maps and
cross-sections and subsurface horizon renditions to get a feel for the useful information stored in a 3-D seismic volume.
In fact, the key to understanding these volumes are the new visualization tools which allow the volume to be evaluated as a
whole, including prestack offset information, hundreds of seismic attributes, legacy data from the same area, well locations,
synthetic seismic traces derived from well log data, engineering data like temperatures, pressures, fluid types,
production rates, etc., etc., etc. These volume display tools help illustrate depth much better than standard maps.
Using these tools, the third dimension becomes intuitive. The new display tools allow those who do not regularly work
with volumes of data to have the same gut feel understandings of the third dimension as drillers, air traffic controllers,
and others who routinely work with the third dimension every day.
Despite the pervasive use of maps in both science and the history of religion,
it seems a paradox there has not been a unifying approach undertaken to integrate these maps in a way to better
understand how scientific and religious space and location overlap. One of the objectives of writing this book is to
identify folks interested in taking on this type of integration, and to find ways to accomplish
merging the science-religion matrix.
|
timedex
infinite grid
-088-
|