|
... II. The Framework ...
values

 paradoxes
|
Maps are everywhere in the oil industry. Exploration starts with the outcrop maps, and
understanding the geology of an area. This rapidly moves to ownership questions, and specifically who owns the property
surface and mineral rights, which are included in the exploration plan. There are maps locating existing wells in the area.
Maps made of subsurface horizons between these wells. Maps showing the locations of existing and of planned seismic surveys.
Maps are made from gravity, air magnetic, electrical readings, as well as anomalies from satellite images. Lots of maps are
made from seismic data, and from integrating all of these data together. These maps include fault plane maps, and horizon
maps, seismic attribute maps, lithologic distribution maps, fluid distribution maps, migration pathway maps, trap maps,
prospect maps, access maps, drilling maps, pipeline maps, etc. In 1952, an Exxon geologist named Wallace E. Pratt
wrote a professional paper in which he stated “Where oil is first found in the final analysis is in the minds of men (sic).”
Men and women have been looking for smaller and smaller hydrocarbon traps in harder and harder to identify and
reach places for almost a century now. And this process has been controlled by maps.
Of course, artificial ownership boundaries do not fence in the human
mind.2.87 One of the wonders of our world is the human mind, and
the ability to jump from facts to feelings and then to suppositions. Think of all of the ways we map out our plans today.
In business, we make maps of software functionality, competitive landscapes, and virtual worlds. We map out our strategy,
and know that without a roadmap and a goal, we will not arrive at the goal. These plans go beyond space and time and
location and traditional maps, which are 2-D physical sheets of paper or images on a computer screen. One of the key
reasons traditional paper maps are becoming obsolete is because as soon as they are printed, they are out of date.
There are so many things being discovered in so many areas today, that maps need to be dynamically updated.
The speed of today’s world requires a new way to integrate insights and discoveries and legacy data into a single unified entity.
One of the points of the presentation on The Impending Obsolescence of Maps
was to point out the fact technologies are changing what we consider a map to be and how we work with those maps.
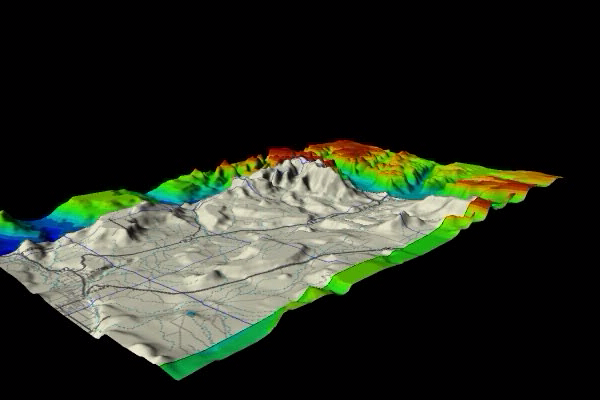
We now routinely texture map data and maps on three-dimensional renditions of topographic or subsurface geology
maps (see Figure 29). These three-dimensional displays are intuitively obvious.
Just as we do not have to be taught how to walk around the kitchen table, we do not have to be taught how to understand
a three-dimensional visualization of topography or even of complex scientific data types. It is part of being a human being
to be able to intuitively understand the third dimension. Computers are allowing easier and easier access to data displayed
proportional to its natural spatial location. And these displays can be magnified or shrunk to allow human scale visualization,
where we literally walk through a virtual reality display.
|
timedex
infinite grid
-087-
|