|
... II. The Framework ...
values

 paradoxes
|
Physical space and locations
Human beings are very good at pattern recognition. Some scientists would argue this capability
comes from eons of evolution. The idea being that as hunter-gatherers, the survivors were those who best identified dangerous
predators or enemies, and took appropriate protective action. For anyone who has gone hunting, there is no question about how
a deer or a dove can be completely camouflaged, then there is a slight movement, and the edges take on instant meaning.
Several facts are clear. We each take up physical space at whatever location we are at.
Rocks and plants and animals and other people also take up physical space at whatever location they are at. We have five senses
which help us understand our relationship to other entities taking up space in the vicinity of our location; namely sight, hearing,
smell, touch, and taste. As a geologist I will lick a clear white crystal to see if it is salt or quartz. As a father I will hug my children
to show them how much I love them. As someone who loves to eat, I will come to the kitchen when something smells good.
As a husband I am striving to do better at hearing requests from my wife. And as someone who is visually dominant, most of my
interaction with other entities which are sharing space in my general location is a reaction to visual observations. As a scientist,
I have learned and worked with people to extrapolate this visual dominance into virtual worlds.
I have learned almost everyone has instant comprehension when they can see and evaluate
data which is displayed proportional to the original physical space and spatial location sources of the data. This was one of the
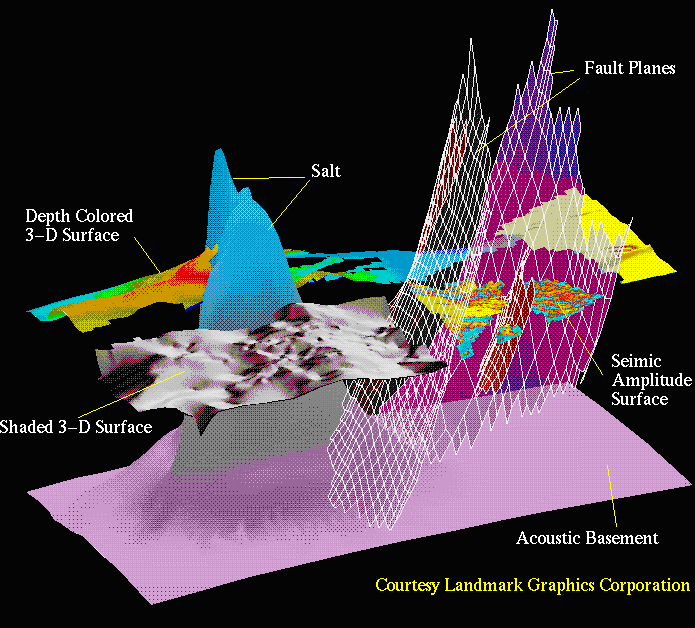
keys of the developments made at Landmark Graphics (see Figure 30). The 3-D displays improve
understanding of our data, and particularly when there are many different data types integrated in very complex relationships.
Just from seismic data, like the example below, one can identify fault planes, salt intrusions, depth colored surfaces, shaded
surfaces, seismic amplitudes related to fluid and lithologic distributions, and the acoustic basement, beneath which there are
no viable data values. Then when well data are integrated into this physical space, geologist are able to: extrapolate seals –
layers of rock with little permeability which restrict the vertical migration of hydrocarbons; identify reservoir rock – layers of
rock with good porosity and permeability where hydrocarbons are likely to be trapped; define hydrocarbon sources – layers
of organic rich rock from which hydrocarbons are derived under burial controlled temperatures and pressures; determine
other lithologic distributions – including beach sands and ancient reefs; predict original depositional environments – including
point bars and turbidity deposits; interpret migration pathways – up fault planes or through connected layers of reservoir rock;
describe reservoir shapes – including sheets or wedges; etc. The point is better answers and better decisions come
by visualizing complex data relationships within context.
|
timedex
infinite grid
-089-
|