|
... II. The Framework ...
values

 paradoxes
|
The concept reminds me of a project done with the database from Nehring Associates,
which covered Texas Railroad Commission’s District 4, or the southern tip of Texas. When these data, consisting of production
and geological data, were put into a 3-D model, there were numerous insights, which jumped out of the model
(see Figure 37). The Vicksburg Formation Production occurs along a narrow trend,
shown by the yellow field locations. Frio Production (green) trends have a large gap in Kennedy County, where much of the
land is controlled by the King Ranch and one oil company, and since there has not been competition, there have not been as
many wells drilled nor as many discoveries as elsewhere along this trend.

Figure 37. Map projection of hydrocarbon production locations colored by formation names for Texas Railroad Commission District 4 in South Texas.
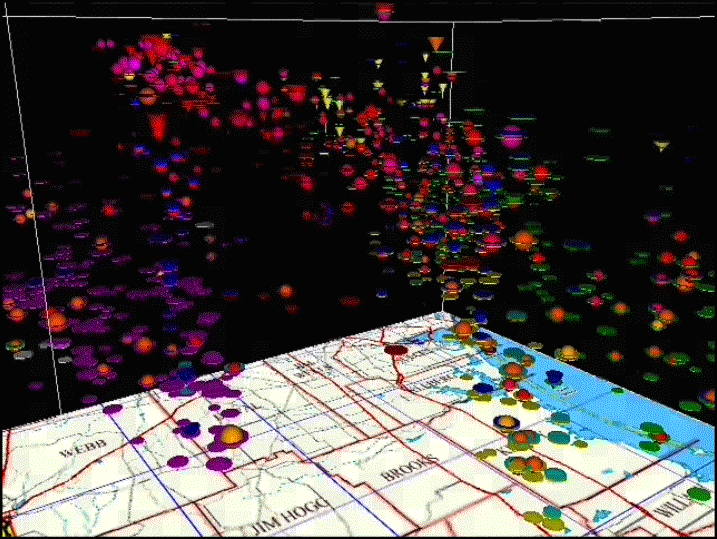
There is also a big gap in production in Starr, Jim Hogg, and Duval Counties. Looking at this same data
tilted at an angle, as shown in Figure 38, this gap is even more pronounced.
In this display additional information has been added to the model,
including spheres showing the porosity of the fields by size, up facing cones showing the location of structural traps, down facing cones
showing the location of stratigraphic traps, in addition to the disks positioned in north, south, and depth space (x,y,z) to show the
location of each field, and colored according to the formation being produced from. Note that the gap goes almost to the surface
and comes up against the purple disks.
|
timedex
infinite grid
-101-
|