|
... II. The Framework ...
values

 paradoxes
|
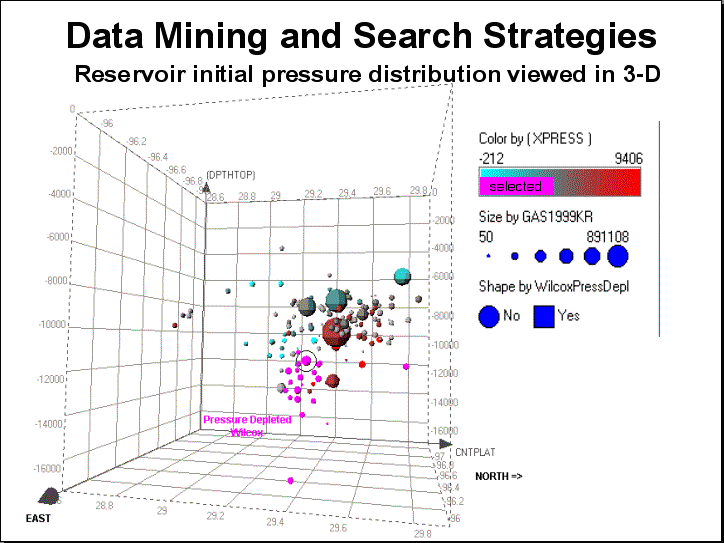
Figure 31. This plot shows the location of all gas fields in Colorado County, Texas.
The small under-pressurized fields colored violet show up nicely on seismic.
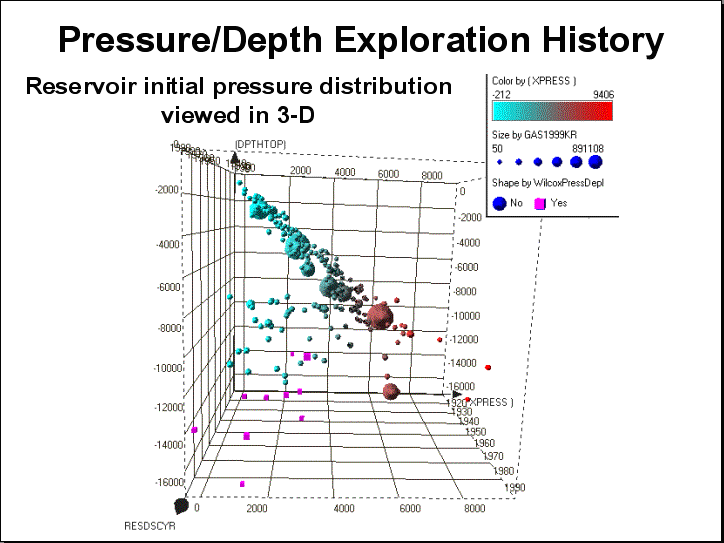
Figure 32. This plot reorders the data as depth vs discovery year vs pressure.
Significant new large discoveries will not be
small under-pressurized fields, rather it will be seismically invisible fields which fall along the depth vs pressure trend.
|
timedex
infinite grid
-093-
|