. . . - . . .  . . .
. . .
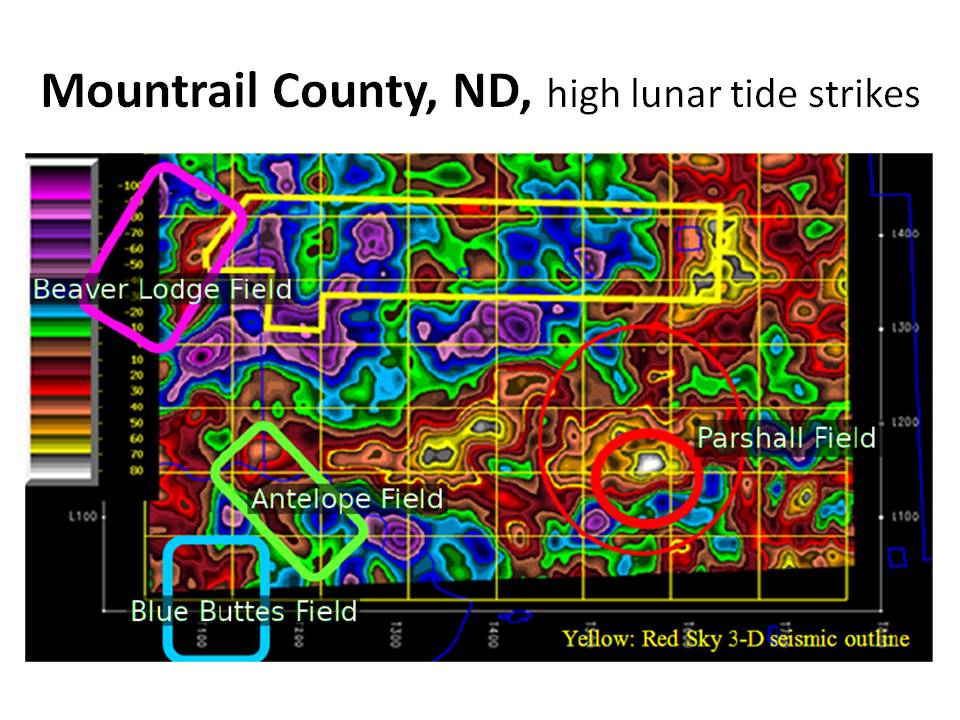
Lithtning analysis can be done along a play fairway, like the Bakken play in Montrail County, North Dakota. The first time I showed this smoothed lightning strike density map at a meeting of oil company executives I did not have any of the overlays on the map. One geophysicist came up and said he had just worked the Red Sky 3-D seismic survey and "there is a large transform at the eastern edge of this survey your lightning analysis seems to highlight and which I can not see on seismic." I went home and found a location map of the Red Sky 3-D survey, overlaid it and sent it to him. He responded, "You show the fault, but notice how you highlight the Parashal Field, the Antelope Field, the Blue Butes Field, and the Beaver Lodge Field." He didn't even mention the Sanish Field, which sits between the Antelope and Parahall Fields. One concern customers have expressed is that the iron in the ground at a field acts like large lightning rods and attracts lightning. A couple of points about this: (1) these patterns are not as obvious on a lightning density map with all strikes shown; and (2) this map only used those strikes which ocurred at high lunar strike. It turns out there are 25% more strikes at high lunar tide than at low lunar tide. We think this is because fault open a little and brines and conductivity increass along the faults. We know we get the same density and patterns of lightning strike over the Beaverlodge Field, the most densly field on the Nesson Anticline, and areas 50 miles to the east and to the west of the field,where there is no infrastructure. Our interpretation is the rock matrix has much more impact on earth currents than drill pipe.
|