. . . - . . .  . . .
. . .
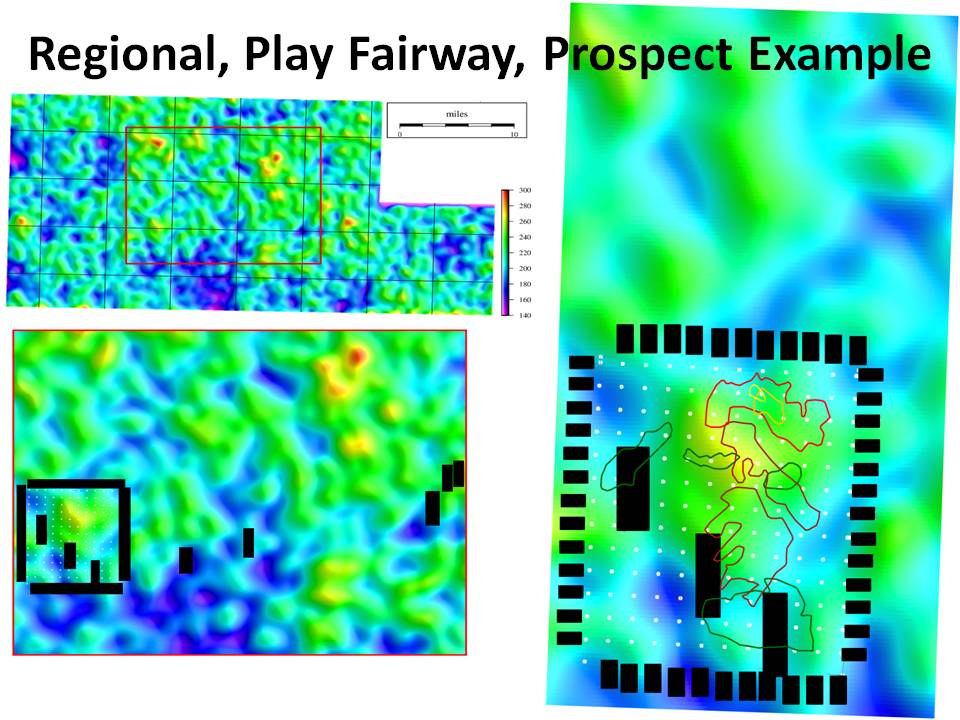
Lightning anslysis can be done to provide context to prospect trends. The area on the right is about 20 miles wide by 40 miles tall. Notice the strong blue lightning pattern coming from the top right to the seismic survey boundary. There is a green outlined Prospect which falls right along this trend. Within the 3-D seismic survey area there is a red prospect outline which falls right along the lightning density anomally. These were the best two prospects from the 3-D seismic interpretation. Looking at the other anomalies on the regional and play fairway scale maps, it is interesting to speculate what seismic interpretation over these evaents would show. We are just starting to understand the potential and limits of lightning analysis maps. (Regional, Play Fairway, Prospects)
|