. . . - . . .  . . .
. . .
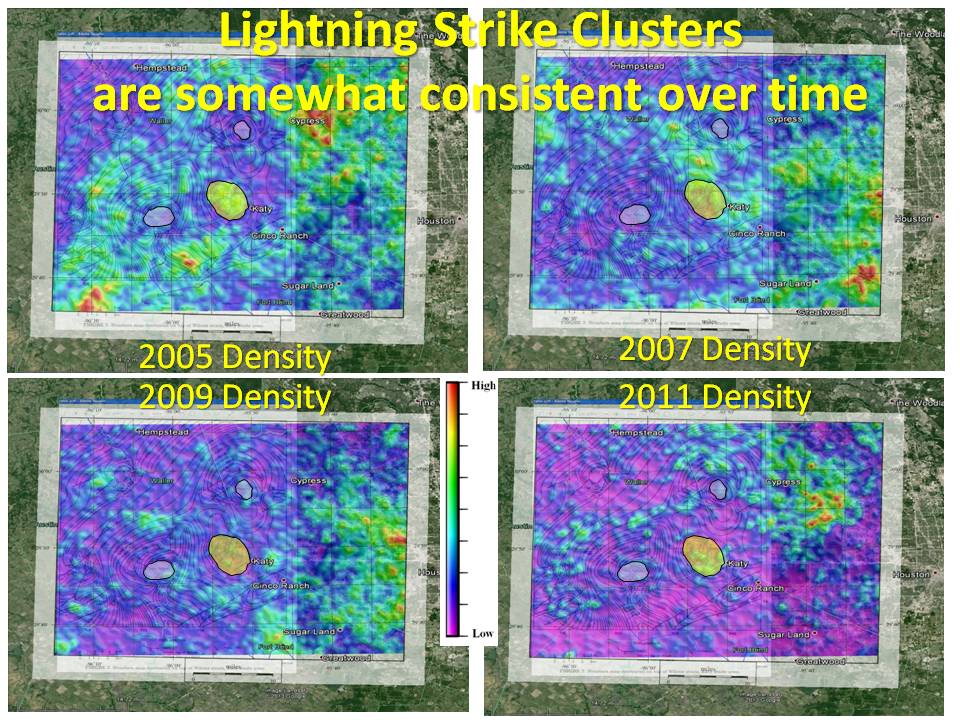
Lightning strikes are somewhat consistent over time. These four maps show lightning density for 2005, 2007, 2009, and 2011. There are similar red patterns in the northease and east side of each map. There are similar low density areas around the two salt domes and the Katy interdomal structure for each of these years. We are still working to quantify the consistancy over time, and on first pass it is interesting.
|